Bee Happy Hives
Loading your dashboard…
A quiet spring so far. One hive wants a look. The rest are settled.
Everything else is settled. See full hive list →
Four apiaries. Nine hives. One good summer so far.
across four apiaries
your apiaries appear here
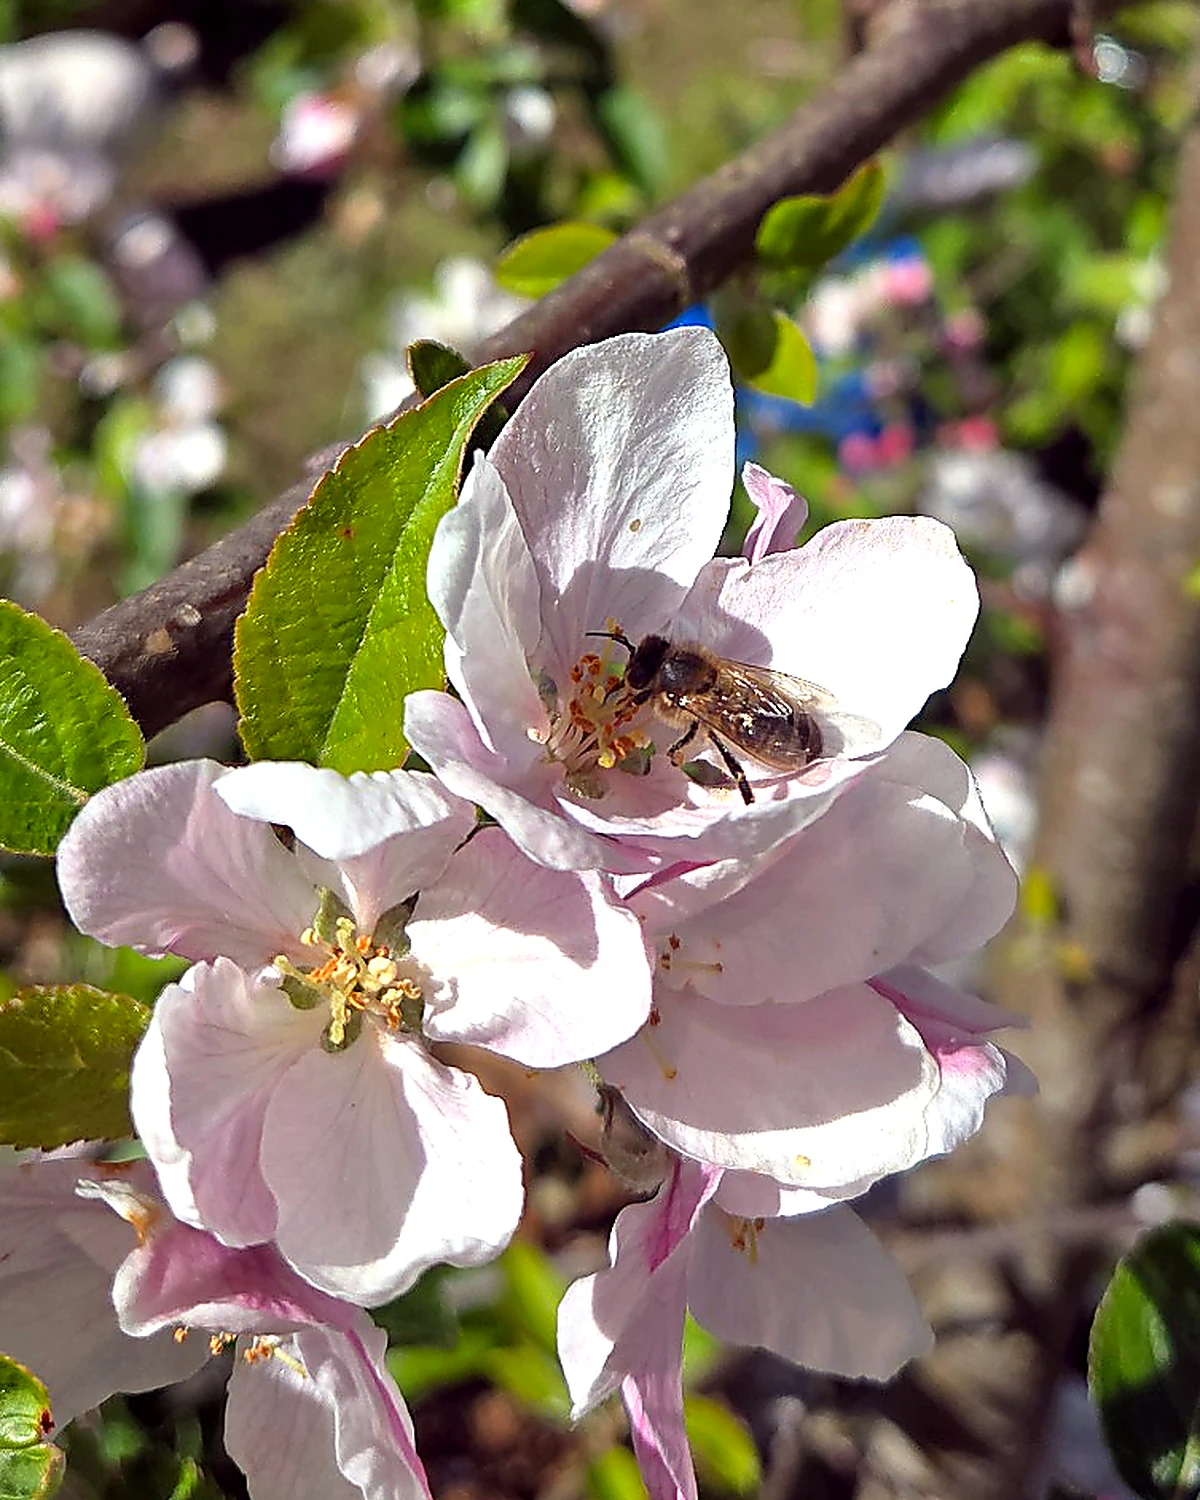
Slemish004 · Belle seen, brood good
What's been done, written as it happened.
What it's doing where your hives are, right now.
Light cloud, gentle breeze
No rain forecast today
Mostly sunny, settled
Dry through Friday
Overcast, calm
Showers tonight
Breezy, cooler air
Dry but cool
Updated this morning. See the Weather tab for the week ahead →
What's flowering, what's flying, what the weather's doing.
Bramble is just opening across the gardens, a week or so behind hawthorn. Hawthorn's been two weeks early this year. The forecast looks settled, 15 to 18 °C, dry into the weekend. A good time to make sure the supers are on and the strong colonies have room.
Prefer no photo diary? Turn it off in Settings →
Every inspection, treatment and feed you've logged is kept quietly in the background. If a bee inspector ever asks, the PDF takes about ten seconds.
Export PDF →Always here, never in the way. Five years of records retained by default.
Tasks, observations and the rhythm of your micro-climate, all in one place.
Some events take weeks. A wizard chain plans the whole sequence.
Queen records · certificates · family tree · inbreeding risk · beehappyhoney.uk
| Queen | Hive | Status | Mother | Origin | Actions |
|---|---|---|---|---|---|
| Sign in to see your queen records. | |||||
Apiary · Varroa · Disease · Feeding · Weather · Equipment
| Date | Hive | Type | Amount |
|---|---|---|---|
| No feeding logs yet. Add a Feeding visit in the phone app to start the history. | |||
| Hive type | Warn at | Critical |
|---|---|---|
| National (cedar) | 5 kg stores | 3 kg |
| National (poly) | 5 kg stores | 3 kg |
| Langstroth | 6 kg stores | 4 kg |
| Nuc (5-frame) | 2 kg stores | 1 kg |
| Nuc (6-frame) | 2.5 kg stores | 1.5 kg |
Different strains have different flying weather windows. AMM (the native dark European bee) tolerates cooler and windier days than Italian bees. Pick your strain. The thresholds opposite update with sensible defaults you can override.
Defaults come from the strain you picked. Override any field if your bees behave differently, e.g. mountain AMM that fly in colder weather.
Loading hives…
“Your hives are quiet. Settle in.”
See the full picture on Insights →| Hive | Location | Type & strain | Last inspection | Sensor | Status |
|---|
| Sensor | Status | Last reading | Battery | Signal | Action |
|---|
What the sensor measures every 15 minutes: total hive weight (kg) · internal temperature (°C) · humidity (%).
GPS: set once during install and locked. The sensor does not re-broadcast GPS — a beekeeper driving past won't move the hive on the map. To change a stored location, use the Update location control on the apiary itself.
Where to place it: The sensor sits under the entire hive on the stand. Not on the crown board — that moves every inspection. The solar panel clips to the side of the hive stand or a stake beside the hive. Never on the roof.
First-time calibration: Weigh your empty hive before adding bees. A cedar National is ~12.5 kg empty. A poly National is ~4 kg. If you don't calibrate, the system can't tell you how many kilos of stores are in there — it will suppress all stores alerts until you do.
Hub: One hub per apiary. Connects over mobile data. Mains-powered where possible; battery + optional solar otherwise. Hub transmits all sensor data to the cloud every 15 minutes.
Inspection log · treatments (VMR 2013) · feeding · harvests · varroa counts
| Date | Hive | Visit type | Queen seen | Brood pattern | Stores | Temper | Varroa | Notes | Next visit / action | Status |
|---|---|---|---|---|---|---|---|---|---|---|
| Sign in to load your inspection records. | ||||||||||
| Date | Status | Hive(s) | Product | Supplier | Batch no. | Dose / method | Prescription / SQP | Withdrawal | Recorded by | Action |
|---|---|---|---|---|---|---|---|---|---|---|
| No treatment records logged yet. Records are kept for 5 years. VMR 2013 best practice. | ||||||||||
| Date raised | Hive | Apiary | Disease | Status | Outcome recorded | Confirmed by | Ref / contact | Notes |
|---|---|---|---|---|---|---|---|---|
| Sign in to load your disease event register. False alarms are kept too. They're part of the record. | ||||||||
| Date | Hive | Feed type | Amount | Reason | Fed by |
|---|---|---|---|---|---|
| Sign in to load your feeding records. | |||||
| Date | Hive | Honey kg | Moisture % | Fullness | Lot code | Stock (made · sold · remaining) |
|---|---|---|---|---|---|---|
| Sign in to load your harvest records. | ||||||
| Date | Hive | Method | Count | Infestation % | Action taken |
|---|---|---|---|---|---|
| No varroa counts logged yet. Use the + button to log your first count. | |||||
Year-on-year bloom observations for your named places
Live conditions, forecast and 30-year climate history for your apiaries.
Six plain-English questions answered from your records. Tap any number or hive name to drill back to the underlying entry.
Whether you reared her yourself, bought her from a local breeder, or caught a swarm off a hedge.
Only fill this out if she crossed a border, came with a certificate, or has a DNA report on file. Most queens skip this section entirely.
Traits you've observed and any free-form notes. Most beekeepers add to this over the season, not on day one.
Loading platform statistics…
| Name | Signed up | Last sign in | Apiaries | Hives | Inspections | Tier | Role | Tier source | |
|---|---|---|---|---|---|---|---|---|---|
| Loading users… | |||||||||